| Model | Accuracy | Hierarchical Accuracy | Top-3 Acc. | Top-5 Acc. | Top-10 Acc. |
|---|---|---|---|---|---|
| flat | 0.3467 | 0.4129 | 0.5201 | 0.6030 | 0.6784 |
| hierarchical_loss | 0.3568 | 0.4229 | 0.5327 | 0.6030 | 0.6884 |
| multiple_outs | 0.2789 | 0.3608 | 0.4347 | 0.4749 | 0.5352 |
| stacked | 0.3090 | 0.3769 | 0.4146 | 0.4447 | 0.4975 |
Case study
Evaluation and Comparison
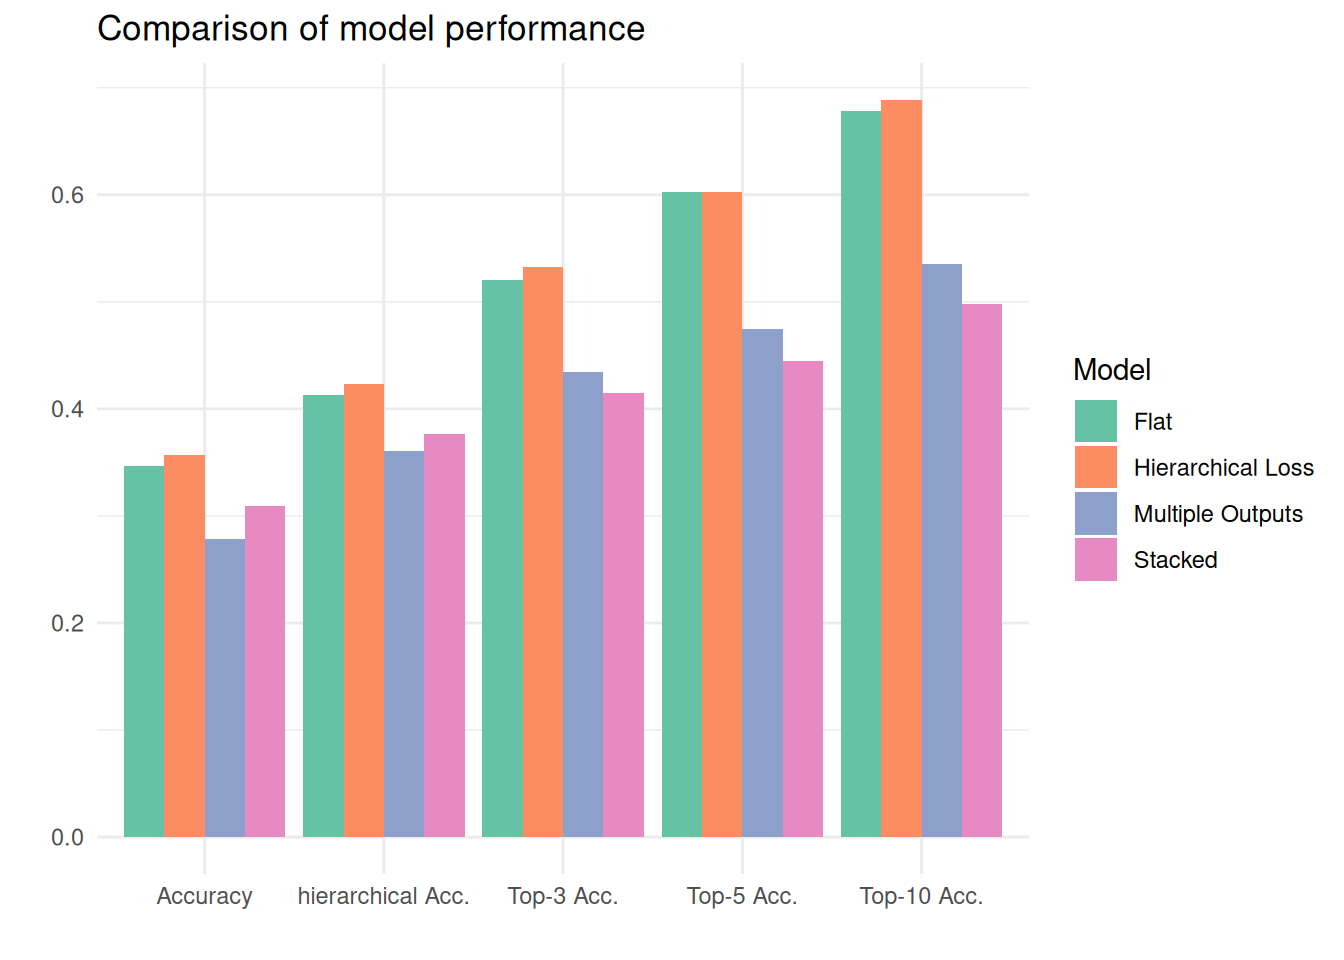
We evaluate all models using accuracy, top-3 accuracy, top-5 accuracy, top-10 accuracy, and weighted hierarchical accuracy. The hierarchical accuracy takes the hierarchy into account, by counting how the number of levels are predicted correctly up to the first incorrect level. If the first predicted level matches the first true code for the first level, we count 1/3. If both the first and the second level match, we count 2/3. If the entire code is predicted, the hierarchical accuracy will be assigned 1. Note that unless the first level-code is correct, we always count 0. For a predicted code where the second and third level are predicted correctly, but the first is not, we will assign 0 to the prediction. The hierarchical accuracy is then computed by the mean of assigned values for all output codes.
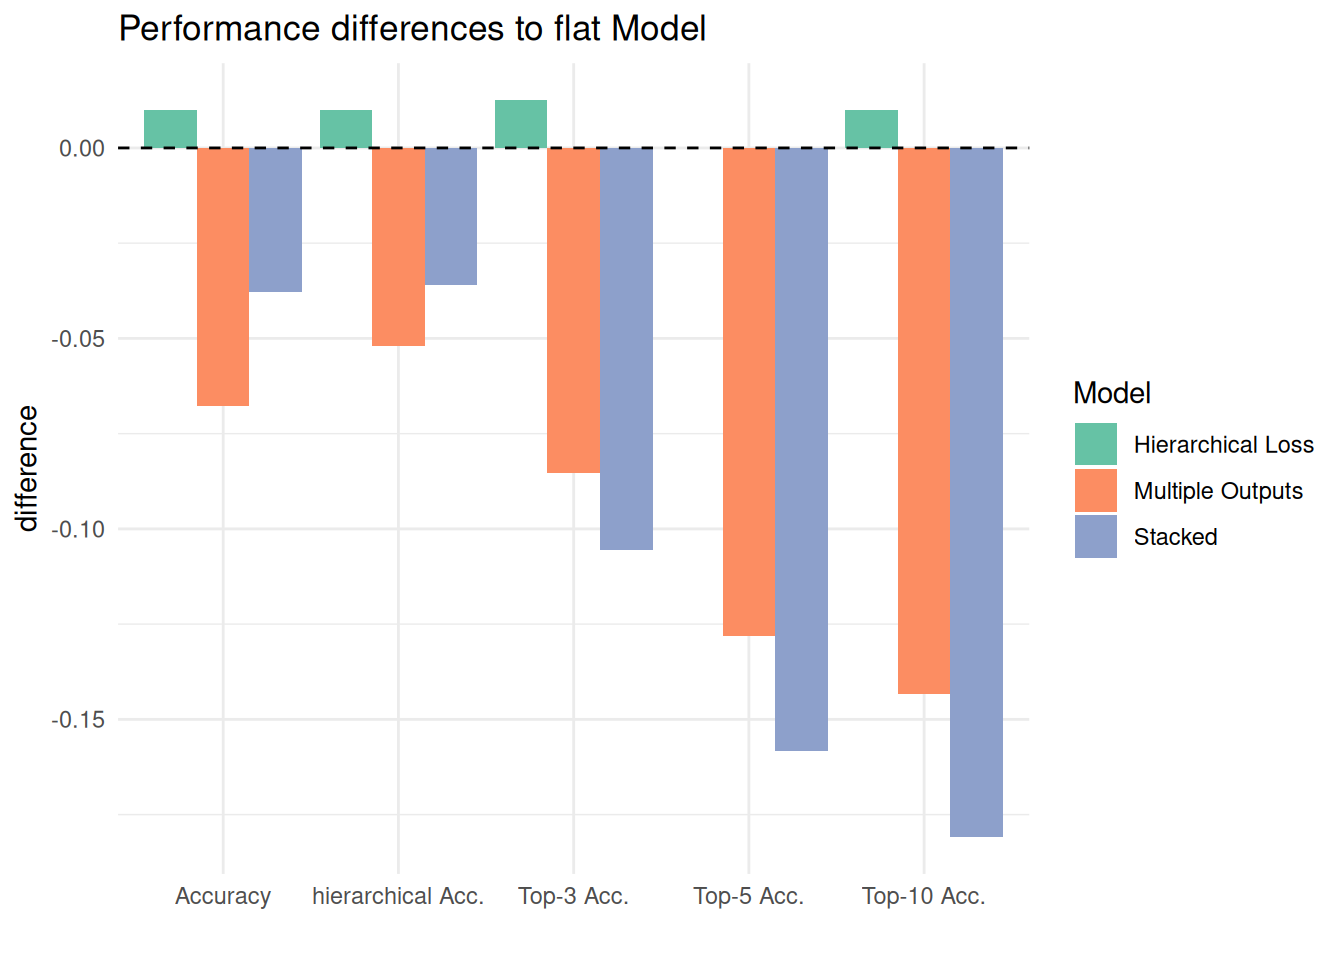
The table below shows the performances of the three hierarchical models and the flat classifier. The figure displays the same results for easier comparison. We find that only one of the hierarchical models, the hierachical loss model, achieves higher scores than the flat model. However, not only is this increase in performance minimal. The performance would have been poorer had the loss function been based solely on the hierarchically informed distance penalty matrix, not combined with cross-entropy loss (ratio 7:3). The stacked and the multiple output model rank lower in performance than the flat model. This could be attributed to the implemented solution of finding the most probable codes. Altering this process might lead to better predictions.
Summary
As compared with a flat model, one of the hierarchical models increased performance slightly. This was the version that is considered hierharchical because its loss function takes input in the form of penalties from a matrix describing the similarity of the classes based on the assumed hierarchy. Even that loss function, however, was in part (30%) also based on “flat” cross-entropy loss. The stacked model (with one classifier per level, LCL) and the multiple outputs model performed worse.