| Code | % encoded automatically | top-5 accuracy | top-10 accuracy |
|---|---|---|---|
| COICOP | 33 | 90 | 95 |
| ISCO | 38 | 93 | 96 |
| ISCED | 15 | 82 | 87 |
| NACE | 13 | 72 | 78 |
Results
Our results show that, depending on the code, between 13% (NACE) and 38% (ISCO) of input strings can be automatically encoded (Phase 1), meaning that a class can be assigned to the input either though high probability of the string matching or the neural network. We selected a threshold of 0.91 for the automatic string matching, as this keeps the error rate below 3-4%, which aligns with the error rate for manual classification.
We found that combining transformer models with other machine learning models can further improve the model’s performance. For this, we train Naive Bayes or XGBoost models on the same training data, where we again use one-hot encoded token IDs as inputs. We then take the predictions of each model separately and calculate the mean of the predictions per class over the models. We then re-rank these mean predictions to obtain a new ranking and with that the combined top-k predictions. Combining transformer models with an XGBoost model works particularly well. Additionally, incorporating variables such as sex, age, and citizenship further enhances model accuracy. Further, we find that using a model with two n-gram inputs instead of one, followed by transformer layers can increase the model performance up to 10% in accuracy.
Overall, the NACE classification model performs worst, with a top-5 accuracy of 72% and a top-10 accuracy of 78%. We believe that the reason for this is that firstly, NACE has the most codes (701 in total) and secondly, the lowest amount of training data (only about 13.000). Further, we believe that NACE classification performs poorly due to the inherent ambiguity in assigning inputs to a single class. Many inputs could plausibly fit into multiple classes, making it challenging to achieve accurate and definitive classifications.
For COICOP, ISCO, and ISCED, we achieve top-10 accuracies of 90%, 96%, and 87%, respectively. These metrics were evaluated on the test set, excluding inputs that were automatically encoded through string matching. The exact results are shown in Table 1.
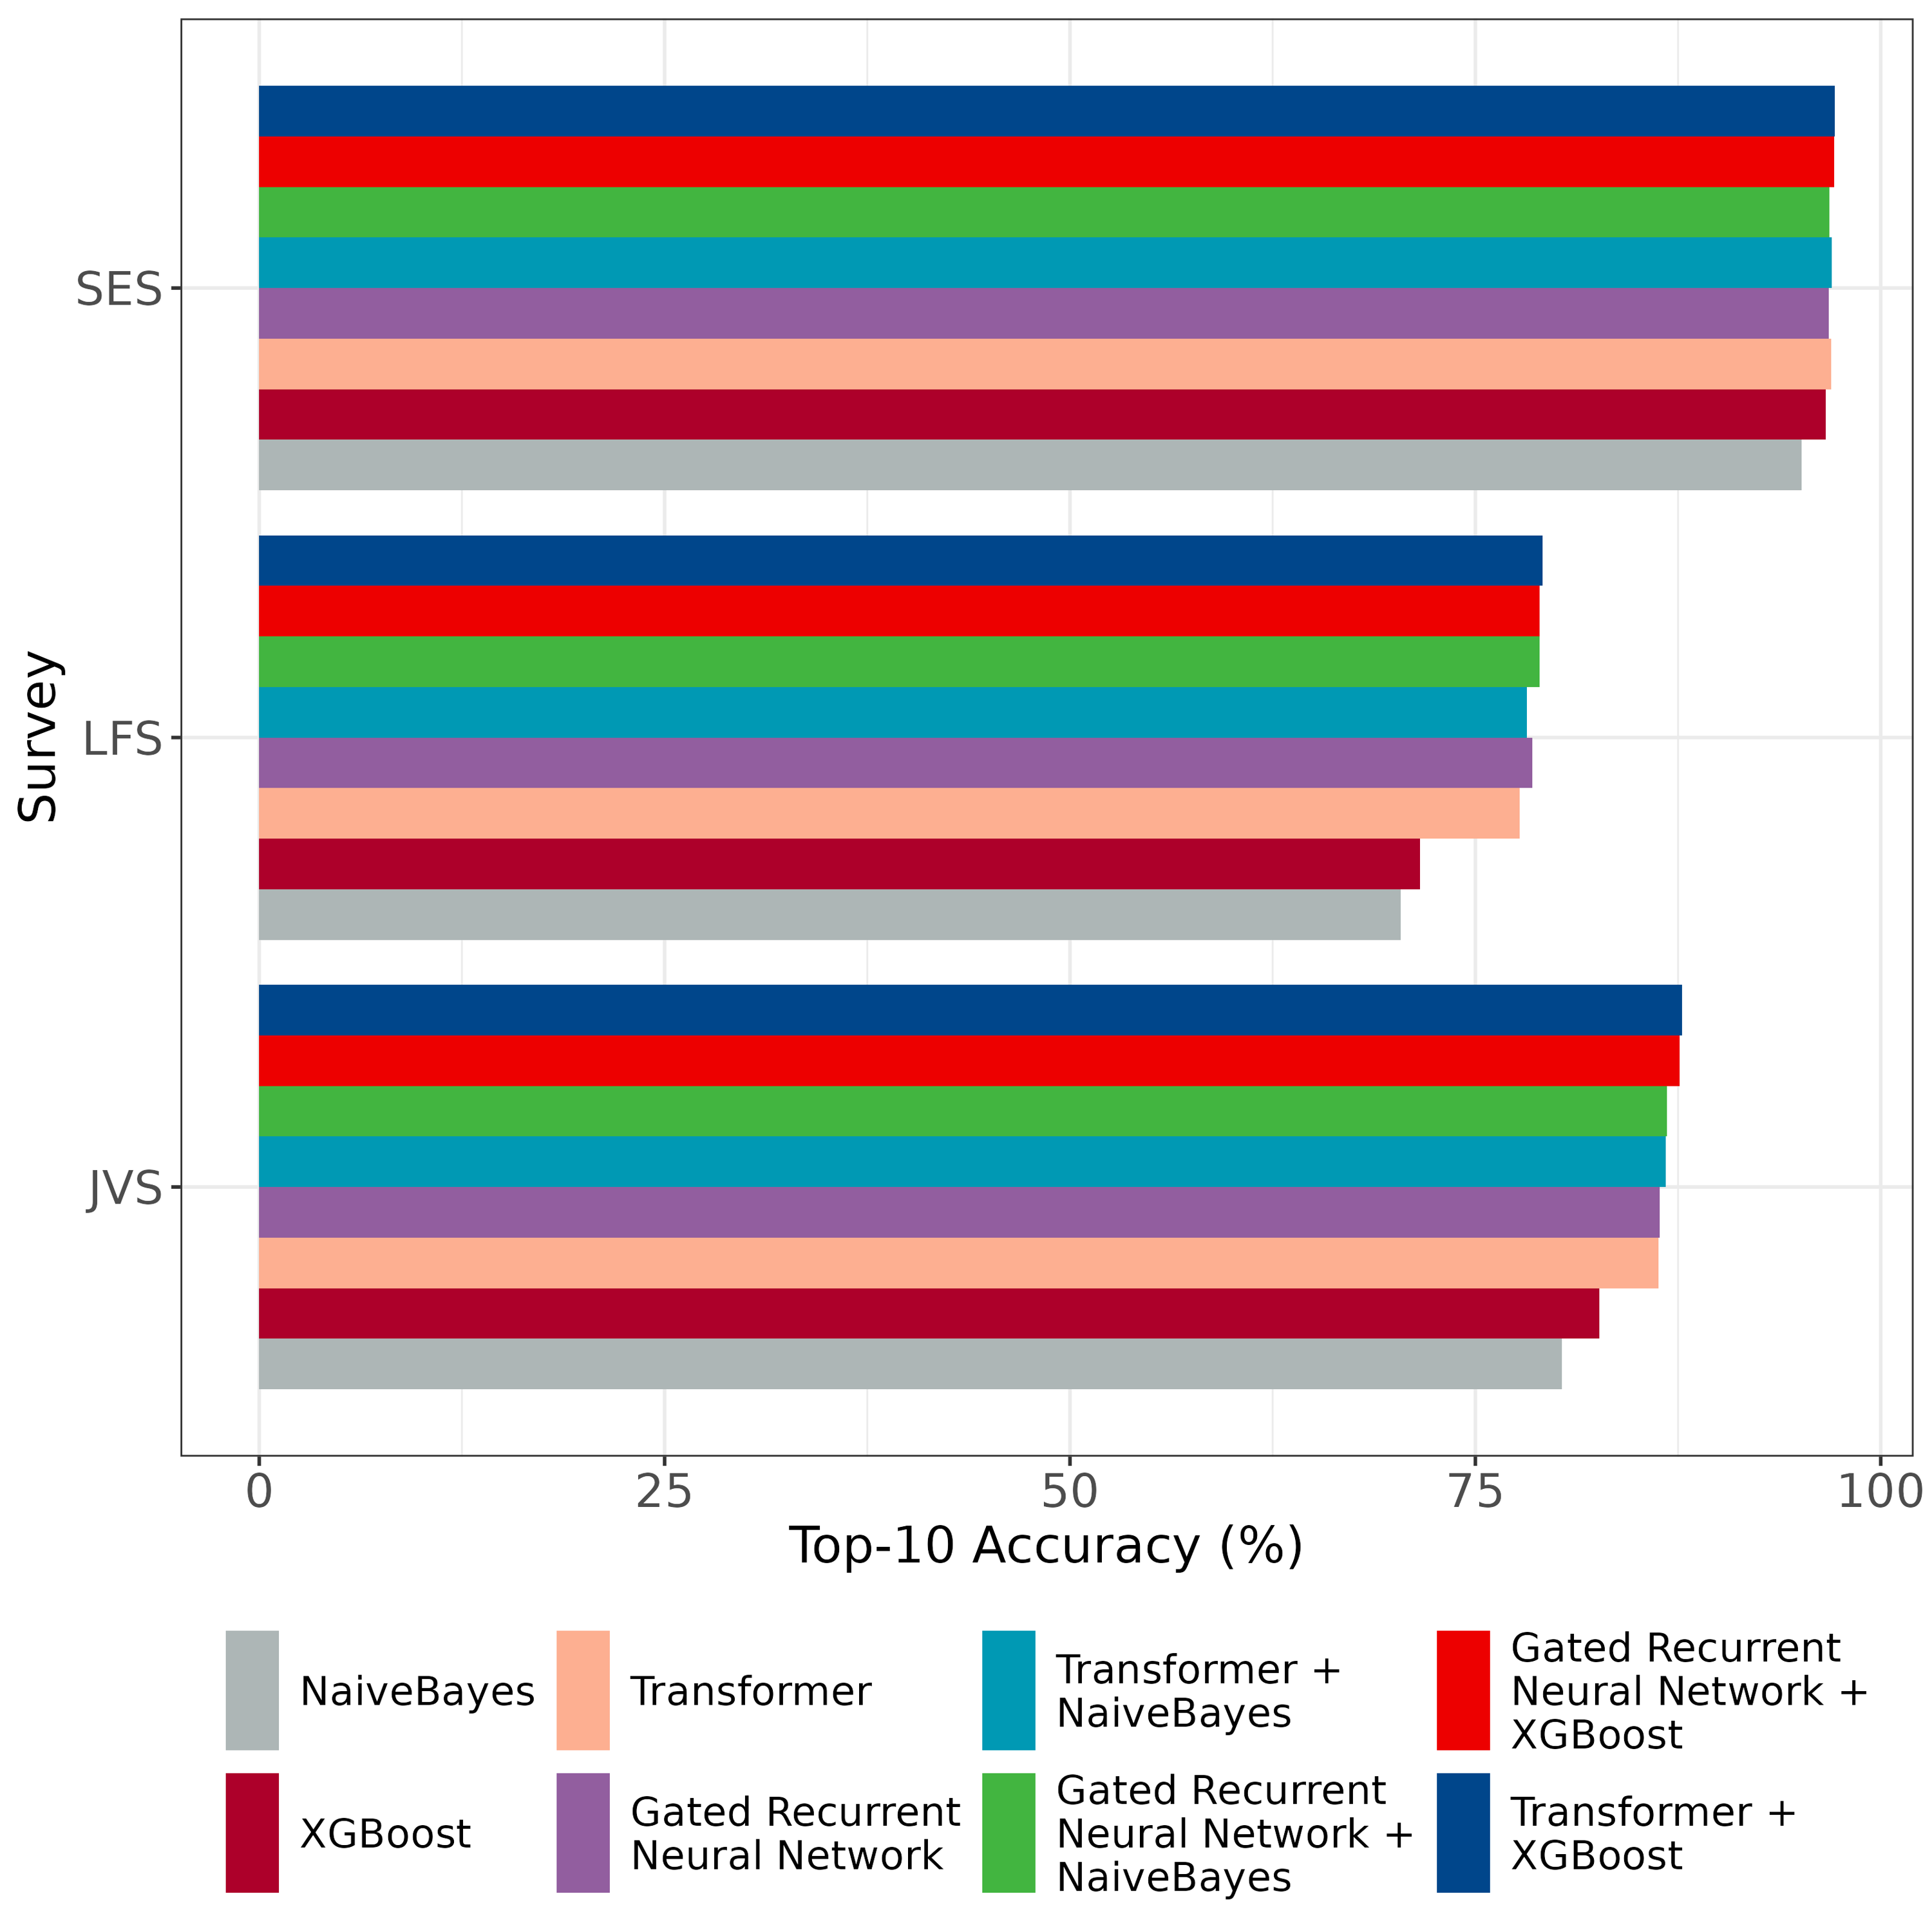
In examining ISCO results by survey type, we observe notable differences in accuracy across surveys. The accuracy for labor force survey (LFS) data is approximately 5% and 19% lower than for the Job Vacancy Survey (JVS) and the Structure of Earnings Survey (SES), respectively. We attribute this gap to the varied input styles across surveys. While the Job Vacancy and Structure of Earnings Surveys are completed by professional personnel, the micro census relies on responses from members of the public, who may lack the specialized terminology needed to accurately describe their job titles. Table 2 shows these results in detail.
| Survey | top-5 accuracy | top-10 accuracy |
|---|---|---|
| LFS | 76 | 82 |
| JVS | 81 | 87 |
| SES | 95 | 97 |
In Figure 1 shows the different models and their performance per survey. For all surveys we conclude that the combination of a transformer and an XGBoost model yields the best predictions. A simple Naive Bayes model continuously scores the lowest in top-10 accuracy.
As an attempt to further improve our models’ performances, we explored hierarchical models. The implementation of some of these models and the collection of their results was done during the course of Cluster 3 and can be found here.